
Introduction to Break-Even Analysis
Break-even analysis is a simple yet powerful tool that helps businesses understand when they start making profit. It identifies the point where total revenue equals total costs, meaning there is no profit and no loss. This point is known as the break-even point (BEP) and is essential for making informed financial decisions.
Every business, whether a startup or an established company, incurs two main types of costs. Fixed costs remain constant regardless of production, such as rent and salaries. Variable costs change with the level of output, like raw materials and packaging. Break-even analysis brings these elements together to show how many units must be sold to cover all costs.
For example, imagine a business that sells a product for 20 per unit. If the fixed costs are 10,000 and the variable cost per unit is 10, the company needs to sell enough units so that the contribution from each sale covers the fixed costs. Break-even analysis helps calculate exactly how many units are required to reach that point.
This concept is not only useful for calculating profit thresholds but also for planning pricing strategies, controlling costs, and assessing risk. It allows business owners to answer practical questions such as how sales changes affect profit or how cost increases impact sustainability.
In simple terms, break-even analysis acts as a financial safety marker. It tells businesses the minimum level of performance needed to avoid losses and provides a clear foundation for growth and profitability.
What is Break-Even Point (BEP)?
The Break-Even Point (BEP) is the level of sales at which a business covers all its costs but makes no profit and no loss. At this point, total revenue is exactly equal to total costs, meaning the business is just “breaking even.”
In simple terms, BEP answers a very practical question:
How many units do I need to sell to avoid losses?
To understand this better, it is important to know the three key elements involved:
• Fixed Costs such as rent, salaries, and insurance that do not change with production
• Variable Costs such as raw materials that increase with each unit produced
• Selling Price per Unit which is the amount charged to customers
The break-even point occurs when the contribution from each unit sold is enough to cover all fixed costs.
Example:
Suppose a business sells a product for 20 per unit
Variable cost per unit = 10
Fixed costs = 10,000
Each unit contributes:
20 − 10 = 10 (contribution per unit)
To cover fixed costs:
10,000 ÷ 10 = 1,000 units
The business must sell 1,000 units to break even
Before this level, the business is making a loss. After crossing this point, every additional unit sold contributes directly to profit.
The break-even point is a crucial concept because it helps businesses:
• Set realistic sales targets
• Make better pricing decisions
• Understand their risk level
In short, BEP acts as a financial turning point, showing when a business moves from loss to profit.
Break-Even Analysis Formula
Break-even analysis uses simple but powerful formulas to determine the point where a business covers all its costs without making profit or loss. These formulas are based on the relationship between costs, price, and contribution.
1. Break-Even Point (in Units)
This is the most commonly used formula. It tells how many units must be sold to break even.
Key Insight:
The denominator is called Contribution per Unit
2. Break-Even Point (in Sales Value)
Where:
Contribution Margin Ratio = Contribution ÷ Sales
This formula shows the total revenue required to break even.
3. Contribution Margin Formula
Contribution tells how much each unit helps in covering fixed costs and generating profit.
4. Contribution Margin Ratio
This ratio is useful when calculating break-even in sales value instead of units.
Quick Example (Putting It All Together)
Fixed Costs = 10,000
Selling Price = 20
Variable Cost = 10
Contribution per unit = 20 − 10 = 10
BEP (Units) = 10,000 ÷ 10 = 1,000 units
CM Ratio = 10 ÷ 20 = 0.5
BEP (Sales) = 10,000 ÷ 0.5 = 20,000
Final Insight
These formulas are simple, but they provide powerful financial clarity. Once you understand contribution and cost behavior, break-even analysis becomes an easy and highly practical tool for decision making.
Key Components of Break-Even Analysis
Break-even analysis is built on a few core components that directly influence whether a business makes a profit or a loss. Understanding these elements clearly is essential because even a small change in one component can significantly impact the break-even point.
Fixed Costs
Fixed costs are expenses that remain constant regardless of the level of production or sales. These costs must be paid even if the business produces nothing.
Examples include:
• Rent and utilities
• Salaries of permanent staff
• Insurance and depreciation
Insight:
Higher fixed costs mean the business needs to sell more units to break even.
Variable Costs
Variable costs change directly with the level of output. The more units produced or sold, the higher these costs will be.
Examples include:
• Raw materials
• Packaging
• Direct labor (if production-based)
Insight:
An increase in variable cost reduces profit per unit and raises the break-even point.
Selling Price per Unit
This is the price at which each product is sold to customers. It plays a crucial role in determining revenue.
Insight:
A higher selling price increases contribution and helps the business reach break-even faster, while a lower price does the opposite.
Contribution Margin
Contribution margin shows how much each unit contributes toward covering fixed costs and generating profit.
Example:
Selling price = 20
Variable cost = 12
Contribution = 8 per unit
Contribution Margin Ratio
This ratio expresses contribution as a percentage of sales and is useful for calculating break-even in sales value.
Final Understanding
All these components are interconnected. A change in one element affects the entire break-even calculation.
• Higher fixed costs increase risk
• Higher variable costs reduce margins
• Higher selling price improves profitability
• Strong contribution margin leads to faster break-even
Mastering these components helps students not only solve numerical problems but also analyze real business situations with confidence.
Contribution Margin Explained
The contribution margin is one of the most important concepts in break-even analysis. It shows how much each sale contributes toward covering fixed costs and generating profit. In simple terms, it is the portion of revenue left after deducting variable costs.
Basic Formula
This formula calculates how much one unit contributes.
Understanding with Example
Suppose:
Selling price = 50
Variable cost = 30
Contribution per unit = 50 − 30 = 20
This means every unit sold adds 20 toward covering fixed costs. Once fixed costs are fully covered, this contribution becomes profit.
Total Contribution
Example:
Contribution per unit = 20
Units sold = 1,000
Total Contribution = 20 × 1,000 = 20,000
Contribution Margin Ratio
This ratio shows contribution as a percentage of sales.
Example:
Contribution = 20
Selling price = 50
CM Ratio = 20 ÷ 50 = 40%
Why Contribution Margin Matters
• It helps calculate the break-even point
• It shows how quickly a business can recover fixed costs
• It supports pricing decisions and cost control
• It helps in profit planning
Key Insight
A higher contribution margin means:
• Faster recovery of fixed costs
• Lower break-even point
• Higher profitability potential
Final Understanding
Contribution margin is not just a formula, it is a decision-making tool. Once you understand how each unit contributes to covering costs and generating profit, you can analyze any business situation with clarity and confidence.
Step-by-Step Calculation of Break-Even Point
Calculating the break-even point becomes very easy when you follow a clear step-by-step approach. Instead of memorizing formulas, focus on understanding the flow of calculation.
Step 1: Identify Fixed Costs
Start by determining all fixed costs that do not change with production.
Example:
Fixed Costs = 10,000
Step 2: Determine Selling Price per Unit
Find the price at which each unit is sold.
Example:
Selling Price = 50 per unit
Step 3: Identify Variable Cost per Unit
Calculate the cost that varies with each unit produced.
Example:
Variable Cost = 30 per unit
Step 4: Calculate Contribution per Unit
Calculation:
Contribution = 50 − 30 = 20 per unit
Step 5: Calculate Break-Even Point (in Units)
Calculation:
BEP = 10,000 ÷ 20 = 500 units
Step 6: Calculate Break-Even Point (in Sales Value)
Calculation:
BEP (Sales) = 500 × 50 = 25,000
Final Interpretation
• The business must sell 500 units to break even
• Or generate 25,000 in sales revenue
• Below this level = Loss
• Above this level = Profit
Quick Exam Tip
Always present your answer like this:
Break-even point in units
Break-even point in sales value
Short conclusion
Final Insight
Once you break the process into steps, break-even analysis becomes simple, logical, and highly scoring. The key is to stay organized and calculate each component carefully.
Practical Examples of Break-Even Analysis
Understanding formulas is important, but real clarity comes when you apply them to practical situations. These examples will help you see how break-even analysis works in real business decisions.
Example 1: Simple Product Business
A company sells a product with the following details:
Fixed Costs = 12,000
Selling Price = 40 per unit
Variable Cost = 25 per unit
Step 1: Calculate Contribution
Contribution = 40 − 25 = 15 per unit
Step 2: Calculate Break-Even Point
BEP = 12,000 ÷ 15 = 800 units
The business must sell 800 units to break even
Example 2: Break-Even in Sales Value
Using the same data:
Contribution = 15
Selling Price = 40
Step 1: Contribution Margin Ratio
CM Ratio = 15 ÷ 40 = 0.375
Step 2: BEP in Sales
BEP = 12,000 ÷ 0.375 = 32,000
The business needs 32,000 in sales revenue to break even
Example 3: Target Profit Situation
A business wants to earn a profit of 6,000
Fixed Costs = 12,000
Contribution per unit = 15
Formula:
Required Units = (12,000 + 6,000) ÷ 15 = 1,200 units
To earn profit, the company must sell 1,200 units
Real-World Insight
These examples show how businesses use break-even analysis to:
• Set sales targets
• Plan profit goals
• Make pricing decisions
• Control costs effectively
Final Understanding
Break-even analysis is not just theoretical. It is a practical decision-making tool used daily by businesses to stay profitable and reduce risk. Once you practice a few examples like these, the concept becomes clear and easy to apply.
Break-Even Chart (Graphical Representation)
A break-even chart is a visual tool that shows the relationship between costs, revenue, and output level. It helps you easily identify the point where a business starts making profit without relying only on calculations.
What Does the Chart Show?
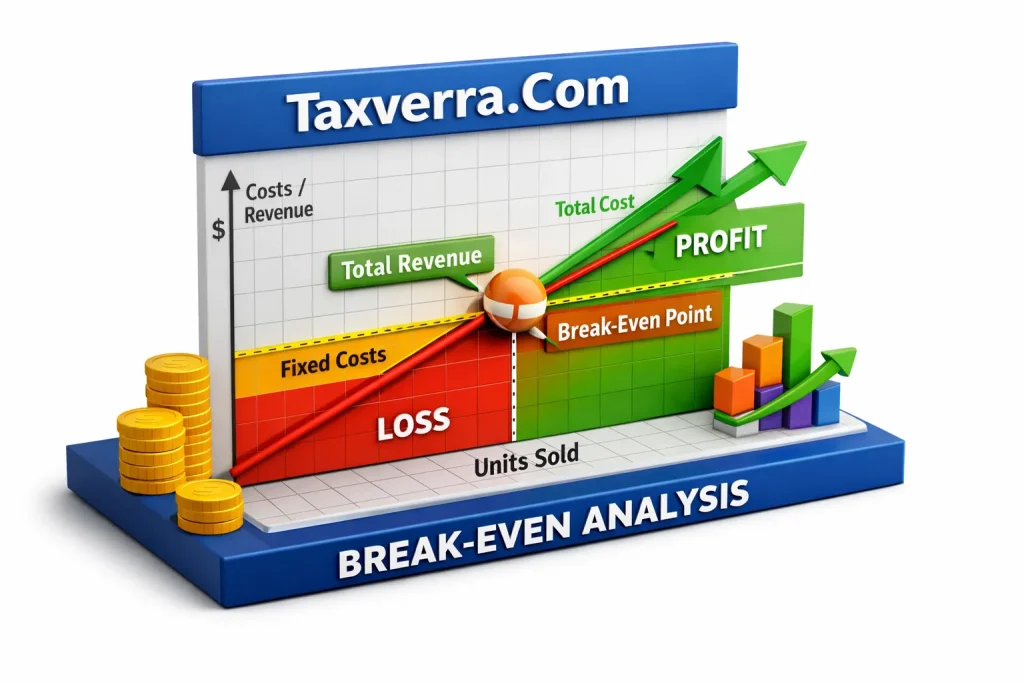
A typical break-even chart includes three main lines:
• Fixed Cost Line → A straight horizontal line because fixed costs remain constant
• Total Cost Line → Starts from fixed costs and increases with production
• Total Revenue Line → Starts from zero and rises as sales increase
The point where Total Revenue = Total Cost is the Break-Even Point (BEP)
How to Understand the Graph
• The X-axis represents number of units sold
• The Y-axis represents cost and revenue
• The intersection point is the break-even point
Profit and Loss Areas
• Left of BEP → Total cost is higher than revenue → Loss
• At BEP → No profit, no loss
• Right of BEP → Revenue exceeds cost → Profit
Simple Example Insight
If a company breaks even at 500 units:
• Selling below 500 units → Loss
• Selling above 500 units → Profit
The graph visually shows how profit increases as sales grow beyond the break-even point.
Why the Break-Even Chart is Important
• Makes complex data easy to understand visually
• Helps in quick decision making
• Shows the impact of cost and price changes
• Useful for presentations and business planning
Final Understanding
A break-even chart turns numbers into a clear visual story. It allows students and managers to quickly see where the business stands and how changes in sales or costs affect profitability.
Margin of Safety
The margin of safety is a key concept in break-even analysis that shows how much sales can drop before a business starts making a loss. In simple terms, it measures the distance between actual (or expected) sales and the break-even point.
It acts as a risk indicator, helping businesses understand how safe they are from losses.
Basic Formula
It can also be expressed as a percentage:
Example
Actual Sales = 50,000
Break-Even Sales = 30,000
Margin of Safety = 50,000 − 30,000 = 20,000
MOS % = (20,000 ÷ 50,000) × 100 = 40%
This means sales can fall by 40% before the business reaches loss
Why Margin of Safety is Important
• It shows the level of risk in a business
• Helps in planning and decision making
• Indicates how stable the business is during downturns
• Useful for managers and investors
Key Insight
• High Margin of Safety → Low risk, strong financial position
• Low Margin of Safety → High risk, small drop in sales can cause losses
Final Understanding
Margin of safety gives a clear picture of how much buffer a business has. It is not just a number, it is a confidence indicator that tells whether the business is operating safely above its break-even point.
Profit Planning Using Break-Even Analysis
Break-even analysis is not only used to find the no profit no loss point, it is also a powerful tool for profit planning. It helps businesses determine how much they need to sell to achieve a target profit and guides decisions related to pricing, costs, and sales strategy.
Target Profit Formula
This formula calculates how many units must be sold to earn a desired profit.
Example
Fixed Costs = 15,000
Selling Price = 50
Variable Cost = 30
Step 1: Contribution per Unit
Contribution = 50 − 30 = 20
Step 2: Calculate Required Units
Required Units = (15,000 + 5,000) ÷ 20 = 1,000 units
The business must sell 1,000 units to earn a profit of 5,000
Profit Planning in Sales Value
This helps when planning revenue instead of units.
Why Profit Planning is Important
• Sets clear sales targets
• Helps in budgeting and forecasting
• Supports pricing decisions
• Ensures business goals are measurable and achievable
Key Insight
• Higher contribution margin → fewer units needed for profit
• Lower costs → faster achievement of profit goals
• Better planning → reduced financial risk
Final Understanding
Profit planning using break-even analysis turns business goals into clear numbers and actionable targets. It allows managers to move beyond survival and focus on growth and profitability with confidence.
Financial Insights from Break-Even Analysis
Break-even analysis is not just about finding the no profit no loss point. It provides powerful financial insights that help businesses make smarter decisions about pricing, costs, and growth. When used properly, it becomes a strategic tool rather than just a calculation.
Understanding Cost Structure
Break-even analysis clearly separates fixed costs and variable costs, helping businesses understand where money is being spent.
Insight:
• High fixed costs increase risk
• High variable costs reduce profit per unit
This helps managers decide whether to reduce expenses or improve efficiency.
Pricing Strategy Decisions
The analysis shows how changes in price affect profitability.
Example Insight:
• Increasing price → higher contribution → lower break-even point
• Decreasing price → lower contribution → higher break-even point
This helps businesses set prices that are both competitive and profitable.
Profit Planning and Target Setting
Break-even analysis allows companies to set clear sales targets.
For example, if a business wants to earn a certain profit, it can calculate how many units must be sold. This makes planning more realistic and measurable.
Risk Assessment and Safety Margin
By using the margin of safety, businesses can evaluate how close they are to losses.
Insight:
A low margin of safety means even a small drop in sales can lead to loss, while a higher margin indicates financial stability.
Impact of Cost Changes
Break-even analysis helps predict how changes in costs affect the business.
• Increase in fixed costs → higher break-even point
• Increase in variable costs → lower contribution
• Cost reduction → improved profitability
This supports better cost control decisions.
Decision Making for Expansion
Before expanding or launching a new product, businesses use break-even analysis to check if the investment is viable. It helps answer:
Will the expected sales cover the new costs?
Final Insight
Break-even analysis transforms numbers into actionable financial insights. It helps businesses understand their cost behavior, manage risk, and make informed decisions that lead to sustainable profitability and growth.
Advantages of Break-Even Analysis
Break-even analysis is a simple yet powerful tool that provides valuable insights for both students and businesses. It helps transform financial data into clear, actionable decisions, making it an essential part of financial management.
1. Simplifies Decision Making
Break-even analysis presents complex cost and revenue relationships in a clear and logical way.
• Helps managers quickly understand financial position
• Supports better short-term and long-term decisions
2. Helps in Profit Planning
It allows businesses to set realistic profit targets and determine how much they need to sell.
• Provides a clear sales target
• Links costs, sales, and profit in one framework
3. Improves Pricing Strategy
By understanding contribution margin, businesses can make smarter pricing decisions.
• Identifies the impact of price changes
• Helps set prices that cover costs and generate profit
4. Supports Cost Control
Break-even analysis highlights the role of fixed and variable costs.
• Helps identify unnecessary expenses
• Encourages efficient cost management
5. Measures Business Risk
Through concepts like margin of safety, it shows how stable a business is.
• High margin → low risk
• Low margin → higher risk
6. Useful for Planning and Forecasting
It helps businesses plan for future operations with more confidence.
• Assists in budgeting
• Supports financial forecasting
7. Easy to Understand and Apply
One of its biggest advantages is its simplicity.
• Requires basic data only
• Easy to calculate and interpret
Final Insight
Break-even analysis is not just a calculation tool, it is a practical guide for smarter financial decisions. It helps businesses stay aware of their costs, manage risk, and move toward sustainable profitability with clarity.
Limitations of Break-Even Analysis
While break-even analysis is a useful tool, it is not perfect. It is based on several assumptions that may not always hold true in real business situations. Understanding these limitations helps students and managers use it more carefully and realistically.
1. Assumes Costs and Prices Remain Constant
Break-even analysis assumes that selling price, fixed costs, and variable costs do not change.
In reality, prices may fluctuate due to competition, and costs can increase بسبب inflation or supply changes. This can make results less accurate.
2. Ignores Changes in Demand
The model assumes that all units produced will be sold at the same price.
However, demand may vary, and selling large quantities might require price reductions, which affects profitability.
3. Oversimplifies Cost Behavior
It assumes costs are strictly fixed or variable, but in reality, many costs are semi-variable or change at different levels of production.
4. Not Suitable for Multiple Products
Break-even analysis works best for a single product.
In businesses with multiple products, different prices and cost structures make it difficult to calculate a single break-even point accurately.
5. Ignores Time Value of Money
Unlike capital budgeting techniques, break-even analysis does not consider the time value of money.
It treats all revenues and costs as if they occur at the same time, which may not reflect real financial situations.
6. Focuses Only on Quantitative Factors
The analysis is based only on numbers and ignores qualitative factors such as:
• Market conditions
• Competition
• Customer preferences
These factors can significantly impact business performance.
7. Limited Use in Long-Term Decisions
Break-even analysis is more useful for short-term planning.
For long-term decisions involving uncertainty and changing conditions, more advanced techniques are required.
Final Insight
Break-even analysis should not be used in isolation. It is best used as a supporting tool alongside other financial methods. When combined with proper judgment and market understanding, it becomes much more effective and reliable.
Real-World Applications
Break-even analysis is not just a classroom concept. It is widely used in real business situations to support practical decision making, cost control, and profit planning. From startups to large companies, it helps answer one critical question: Is this business or project financially viable?
1. Startups and New Businesses
Entrepreneurs use break-even analysis before launching a business to understand the minimum sales required to survive.
• Helps estimate initial risk
• Determines how long it may take to become profitable
• Supports better financial planning
2. Pricing Decisions
Businesses use it to set prices that cover costs and generate profit.
Insight:
If the price is too low, the break-even point increases, making it harder to earn profit. If the price is higher, the business can break even faster.
3. Product Launch Decisions
Before introducing a new product, companies analyze whether expected sales will cover the additional costs.
• Helps avoid launching unprofitable products
• Supports go or no-go decisions
4. Cost Control and Budgeting
Managers use break-even analysis to monitor and control costs.
• Identifies high fixed or variable costs
• Helps improve efficiency and reduce waste
5. Sales Target Setting
Break-even analysis provides a clear minimum sales target for teams.
• Ensures business covers costs
• Motivates teams to achieve profitability goals
6. Expansion and Investment Decisions
Businesses use it when planning expansion, opening new branches, or investing in equipment.
It helps answer: Will increased sales justify the additional costs?
7. Risk Management
Using margin of safety, companies assess how vulnerable they are to a decline in sales.
• Helps prepare for market downturns
• Supports better strategic planning
Final Insight
Break-even analysis connects theory with real business action. It helps businesses make informed, practical, and low-risk decisions, ensuring they move toward sustainable growth and profitability.
Common Mistakes to Avoid
Break-even analysis is simple, but many students and even professionals make small mistakes that lead to wrong conclusions. Avoiding these errors can significantly improve your accuracy in exams and real-world decisions.
1. Ignoring Contribution Instead of Using Profit
A very common mistake is using profit per unit instead of contribution per unit.
✔ Correct approach:
Contribution = Selling Price − Variable Cost
Break-even is based on covering fixed costs, not profit.
2. Mixing Fixed and Variable Costs
Students often misclassify costs, which leads to incorrect results.
• Fixed costs remain constant
• Variable costs change with output
Wrong classification = wrong break-even point
3. Forgetting to Calculate Contribution First
Some directly apply the formula without calculating contribution.
Always follow sequence:
Selling Price → Variable Cost → Contribution → BEP
4. Using Incorrect Formula
Even a small formula mistake can change the entire answer.
5. Ignoring Units vs Sales Value
Students sometimes confuse break-even in units with sales value.
• Units → number of items
• Sales → monetary value
Always check what the question requires
6. Not Showing Proper Steps in Exams
Even if your final answer is correct, skipping steps can cost marks.
Show:
• Formula
• Calculation
• Final answer with units
7. Ignoring Real-World Assumptions
Break-even analysis assumes constant prices and costs, but students often forget this limitation.
In practical questions, always interpret results carefully
8. Calculation Errors
Simple math mistakes like wrong subtraction or division can ruin the answer.
Double-check your calculations
Final Insight
Most mistakes in break-even analysis are not conceptual, they are careless or procedural. By following a structured approach and staying careful with formulas and classifications, you can solve questions accurately and confidently.
FAQs
1. What is the break-even point in simple terms?
The break-even point (BEP) is the level of sales where total revenue equals total costs. At this point, the business makes no profit and no loss.
2. What is the basic formula for break-even point?
It shows how many units must be sold to cover all costs.
3. What is contribution margin?
Contribution margin is the amount left after subtracting variable cost from selling price.
Formula:
Contribution = Selling Price − Variable Cost
It contributes toward covering fixed costs and profit.
4. What is margin of safety?
It is the difference between actual sales and break-even sales. It shows how much sales can drop before the business starts making a loss.
5. Why is break-even analysis important?
It helps in:
• Setting sales targets
• Pricing decisions
• Cost control
• Risk analysis
6. Can break-even analysis be used for multiple products?
It is difficult because each product has different costs and prices. In such cases, businesses use a weighted average contribution.
7. What happens after the break-even point?
After crossing BEP, every additional unit sold contributes to profit, because fixed costs are already covered.
8. Is break-even analysis useful for real businesses?
Yes, it is widely used for planning, budgeting, and decision making, especially in pricing and cost management.
9. What are the key assumptions of break-even analysis?
• Costs and prices remain constant
• All units produced are sold
• Costs can be clearly divided into fixed and variable
10. What is a good margin of safety?
A higher margin of safety is better because it indicates lower risk and greater financial stability.
Final Tip
For exams, keep your answers clear, formula-based, and practical. Most questions are built around basic concepts, so strong fundamentals will help you score high.
Conclusion
Break-even analysis is one of the most practical and easy-to-understand tools in finance. It helps you clearly see the relationship between costs, sales, and profit, making it easier to understand how a business actually performs.
By learning key concepts like contribution margin, break-even point, and margin of safety, you gain the ability to not only solve exam questions but also analyze real business situations with confidence. It turns numbers into meaningful insights and helps answer critical questions like how much to sell, what price to set, and how to manage costs effectively.
For students, it is a high-scoring topic because it combines theory with calculation. For businesses, it is a decision-making tool that supports pricing, planning, and risk management.
The key is to focus on clear concepts, correct formulas, and step-by-step calculations. Once you master these, break-even analysis becomes simple, logical, and highly useful.
In the end, break-even analysis is not just about finding a point, it is about building a strong understanding of how businesses move from loss to profit and toward sustainable growth.